Tag: matplotlib
-
Visualising Paper Co-Author Collaboration Networks
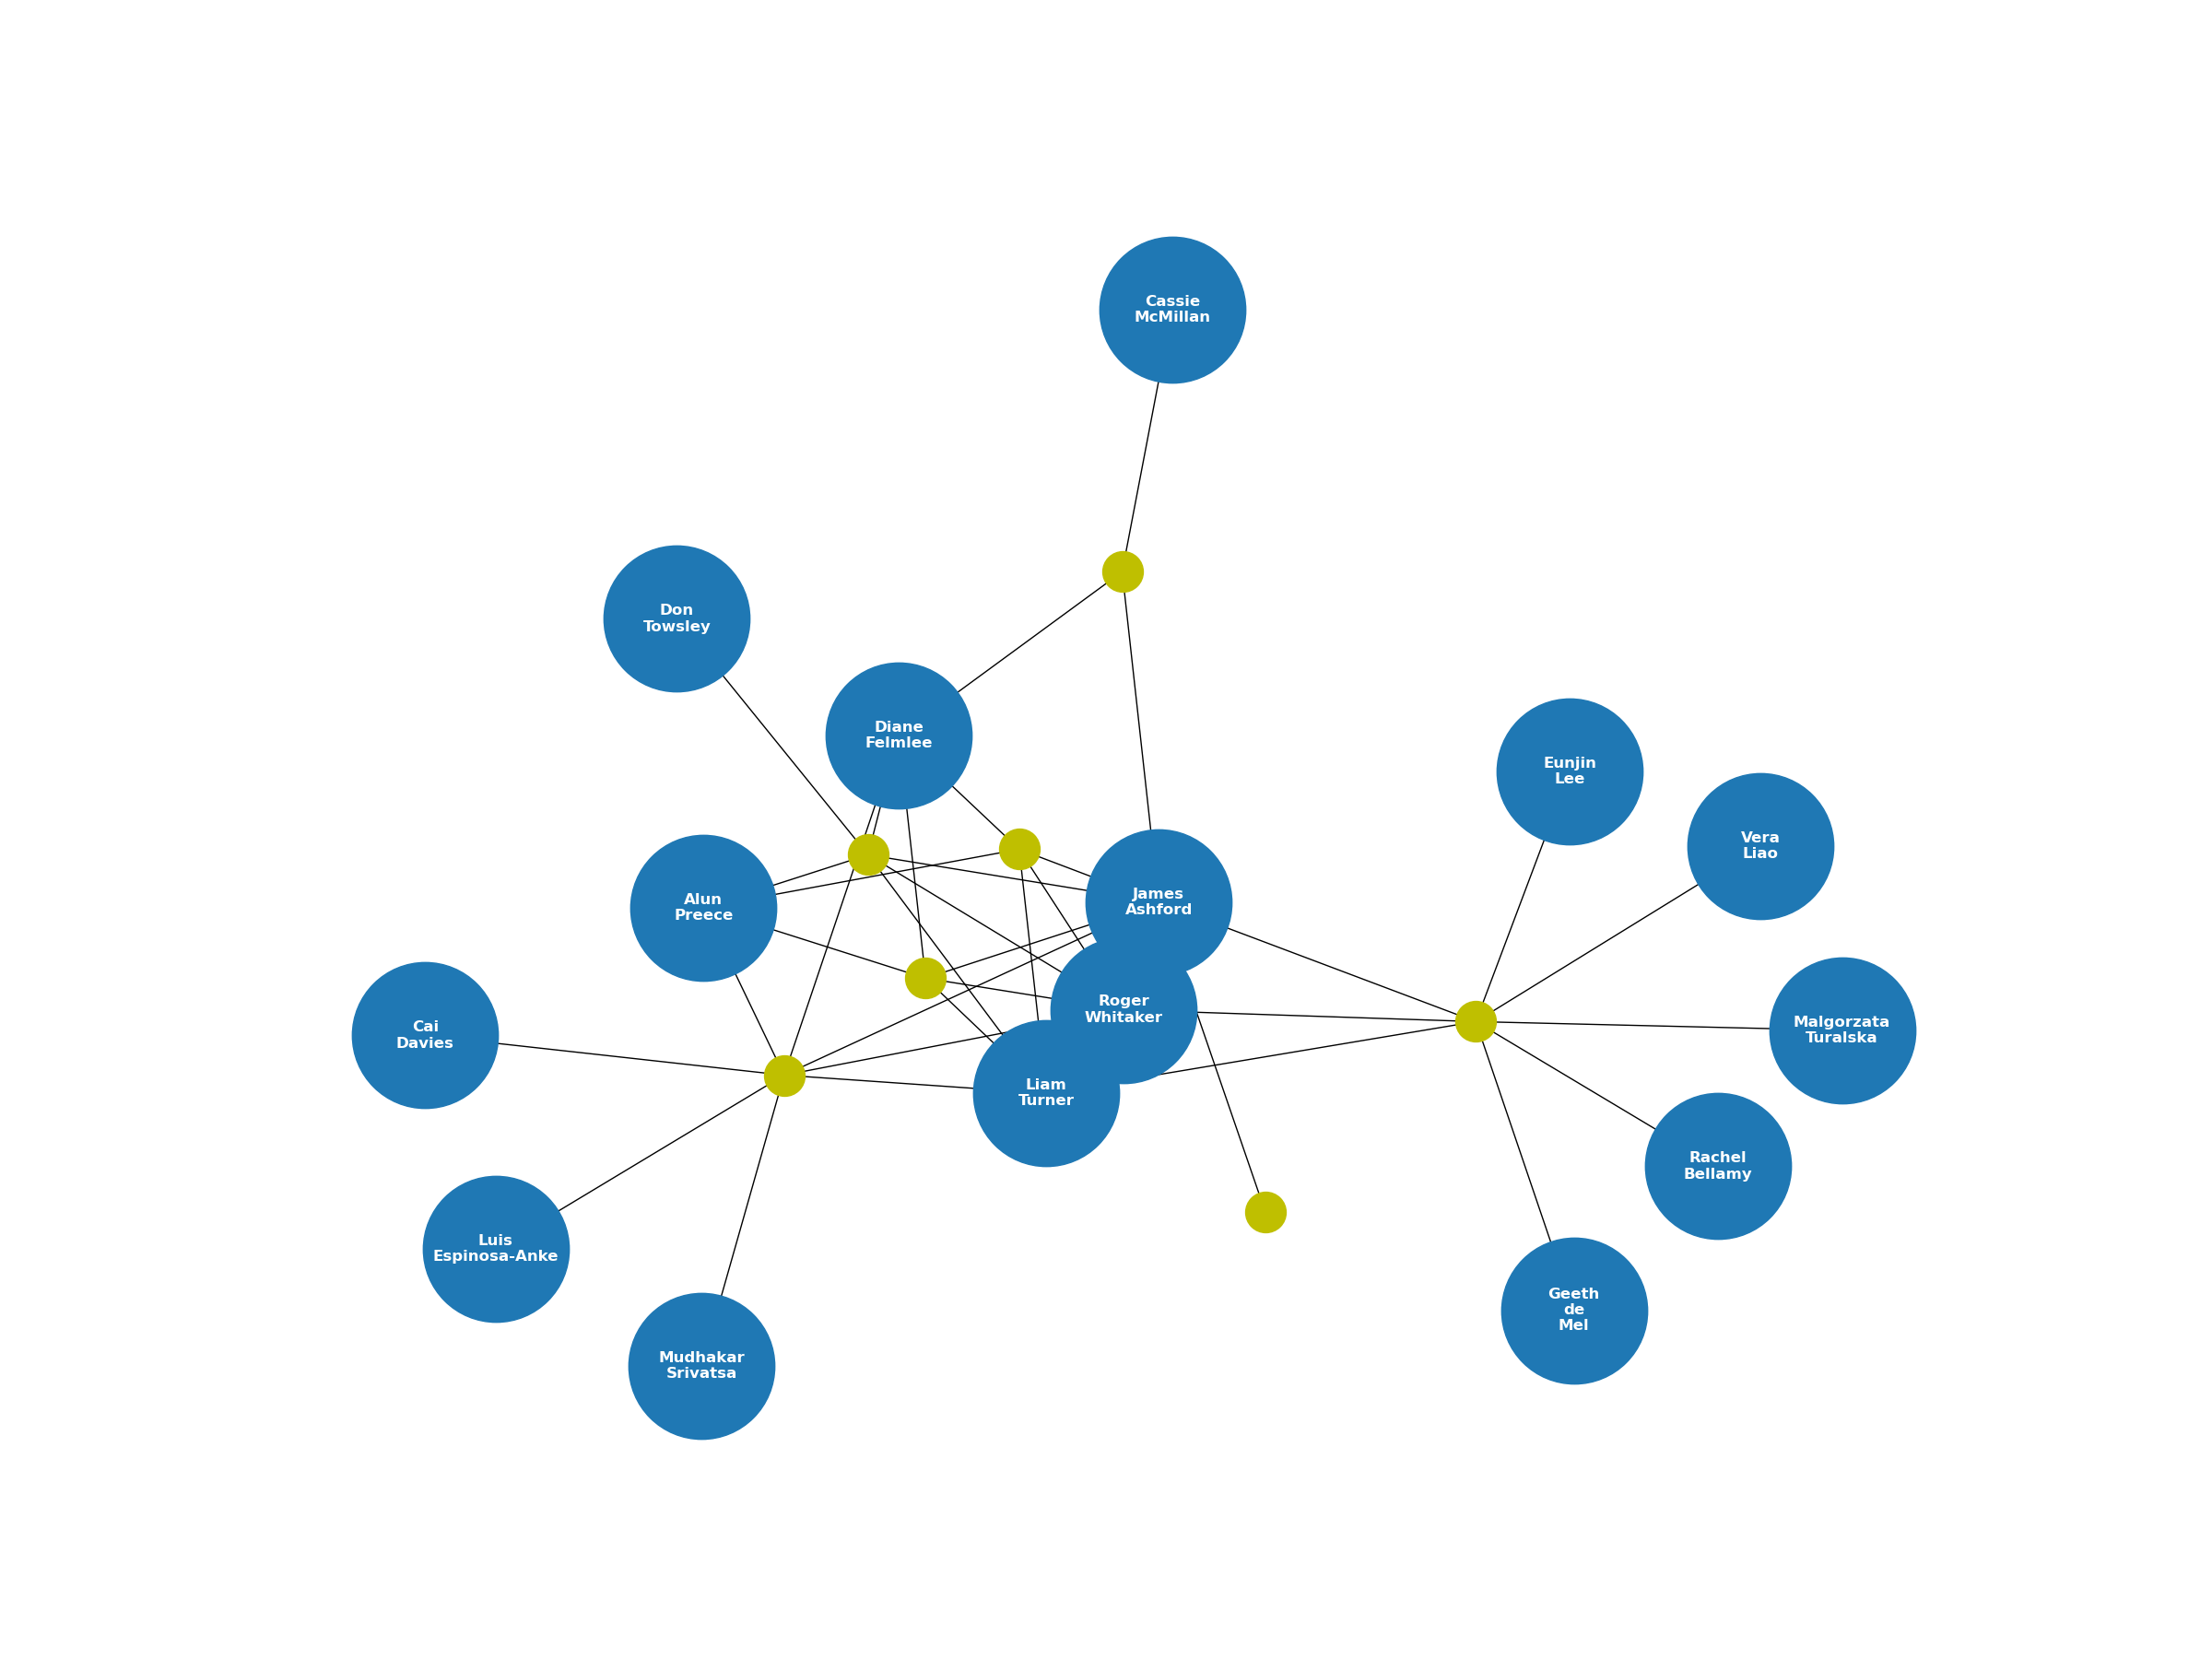
As part of my job as an academic, a large part of what I do involves producing new knowledge by publishing research papers with other fellow researchers, As I was…
-
Analysing the 2023 FIFA Women’s World Cup with Graph Theory
It’s fair to say that I don’t follow many sports. I’m more of a casual observer myself and would much rather watch something like the Tour de France or a…
-
How to Build a Self-Organising Map (SOM) in Python Step-by-Step
In a separate blog post, I covered the basis for understanding how self-organising maps (SOM) work. This included what a SOM is, why SOM’s are useful and how they work…
-
How Self-Organising Maps Work: Explained with Graphics
Artificial Neural Networks (simply known as neural networks) come in all different shapes and sizes and can be designed to solve different types of problems. Classification, regression, supervised and unsupervised.…
-
Best Data Visualisation Packages for Python in 2022 – The Pros, Cons and Cross Comparison
Data visualisation is an incredibly important component of data science. By using visual representations of data, we can help provide meaningful insights which are easy to understand. Conveniently, for those…