As part of my job as an academic, a large part of what I do involves producing new knowledge by publishing research papers with other fellow researchers,
As I was completing a PhD, I had the opportunity to get a few publications out, both as a lead author (along with my supervisors) and as a named author on a paper as a collaborator.
It is through these connections in which research communities are built – though mutual connections on research papers.
To examine this a little closer, I build a small tool which builds and visualises collaboration graphs by taking an author’s paper output (data collected via Google Scholar) and turns them into bipartite graphs – where an edge is used to model the connection between an author and a paper.
Why? To examine the wider researcher community and to discover new collaborative connections with others based upon mutual ties. This, in turn, opens up the potential to form new connections for future collaboration – an essential part of research and academia.
The general algorithm for building a collaboration network can be summarised as follows.
- Step 1: Take a seed author and export a list of associated publications
- Step 2: For each publication, get authors and add an edge between the author and publication
- Step 3: Repeat
The algorithm is fairly simple and similar to what I have done before in a separate post looking at Mastodon followers.
Implementing this in Python is really easy thanks to help from the scholarly Python package. It essentially works as a wrapper library for scrapping data from Google Scholar, as there is no API (yet).
Let’s start with some imports. In my case, I will be using networkx for building the graphs and matplotlib for visualising them.
import networkx as nx
import matplotlib.pyplot as plt
from scholarly import scholarly
With relevant packages imported, we can now move on to the main algorithm, using my profile “James R. Ashford” as an example seed author.
To summarise, the code below, essentially goes through each one of my publications, extracts the co-authors and adds them to the graph G.
seed_author = 'James R. Ashford'
G = nx.Graph()
search_query = scholarly.search_author(seed_author)
author = scholarly.fill(next(search_query))
for p in author['publications']:
publication_filled = scholarly.fill(p)
bib = publication_filled['bib']
title = bib['title'].replace(':', ' ')
title = f"Paper/{title}"
authors = bib['author'].split(' and ')
for author in authors:
author = author.replace('.', '')
author = ' '.join([n for n in author.split(' ') if len(n) > 1])
author = f"Author/{author}"
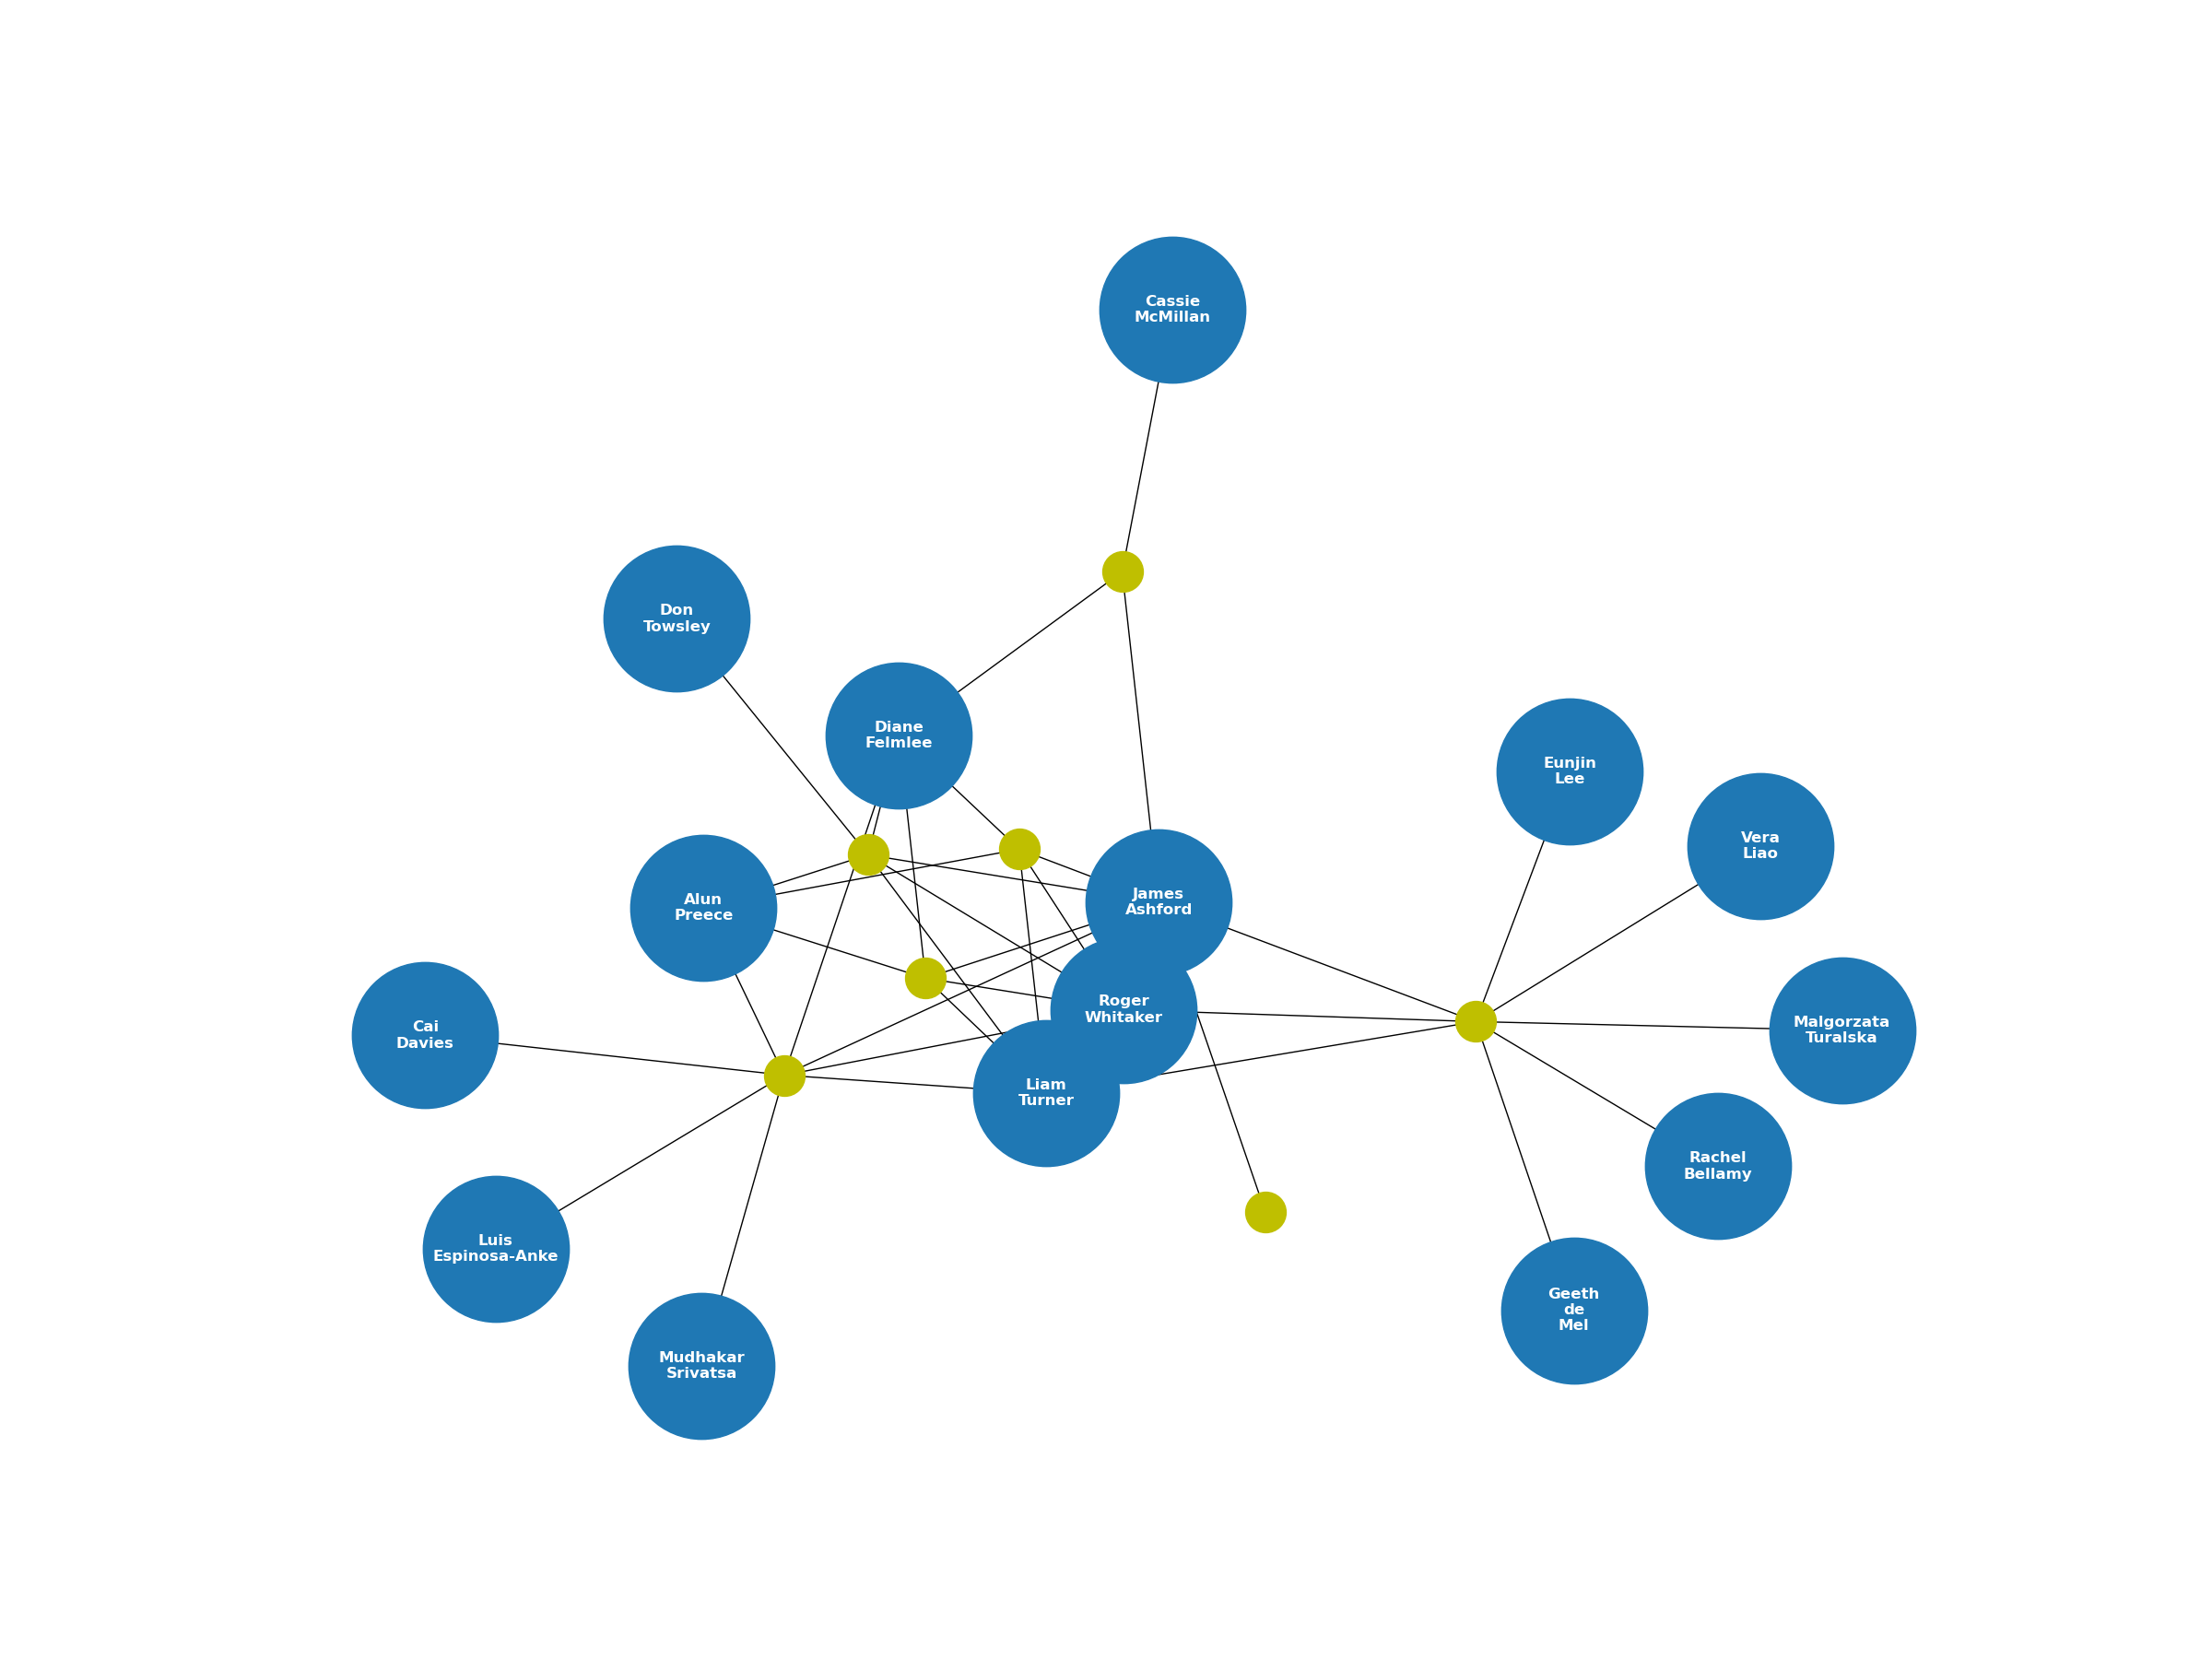
G.add_edge(author, title)Again, we can use matplotlib, with some help from networkx, to visualise the resulting network. To make things easier to visualise, I have labelled author nodes and changed their colour to differentiate them from papers.
Note: I am using the graphvis layout, which produced much neater visualisations and in a fraction of the time. If you plan on doing this, you will need to have graphviz installed first.
pos = nx.nx_pydot.graphviz_layout(G, prog='sfdp')
max_len = max([len(n) for n in G.nodes() if n.startswith('Author/')])

plt.figure(figsize=(24, 18))
nx.draw_networkx_nodes(G, pos,
    nodelist=[n for n in G.nodes() if n.startswith('Author/')],
    node_size=max_len*500)

nx.draw_networkx_nodes(G, pos,
    nodelist=[n for n in G.nodes() if n.startswith('Paper/')],
    node_color='y',
    node_size=1000)

nx.draw_networkx_edges(G, pos)
nx.draw_networkx_labels(G, pos,
    labels={n: n.split('/')[-1].replace(' ', '\n') for n in G.nodes() if n.startswith('Author/')},
    font_color='w',
    font_weight='bold')

plt.axis('off')
plt.show()
As a result, this is what my collaboration graph looks like as of this writing (November 2023).

This graph focuses on collaborations centred around a single author – in this case, just me. However, this code can also be used to observe a wider collaboration community by repeating the algorithm for every co-author in the network based upon mutual connections via papers.